Skip to content
Search
Search
Register
Login
Home
Features
Stories of Change
Teachers & Educators
Educator Roles
Issues & Topics
Image Galleries
Debating DevEd
Infographics
Resources
Blog
Shop
About
Home
Features
Stories of Change
Teachers & Educators
Educator Roles
Issues & Topics
Image Galleries
Debating DevEd
Infographics
Resources
Blog
Shop
About
Home
/
Features
/
Infographics
Bookmark
Infographics
Visualising data for development education.
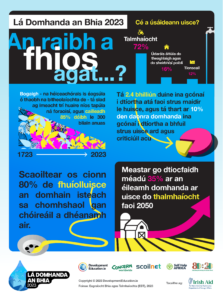
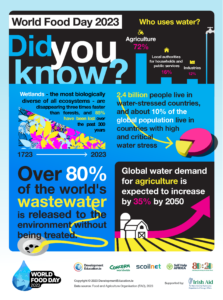
Grafaic: Cé a úsáideann uisce?
Infographic: Do you know who uses the majority of water?
Cancel the Debt – a counter
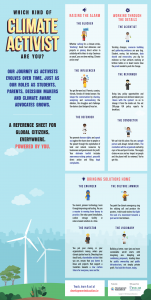
Which Kind of Climate Activist Are You?
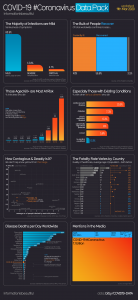
COVID-19 #Coronavirus infographic
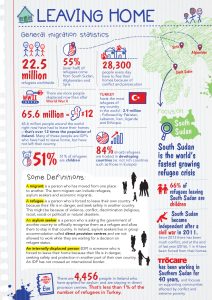
Leaving Home
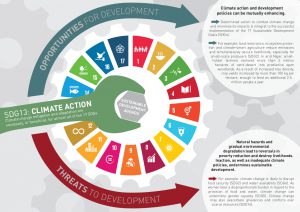
Climate action is vital for development
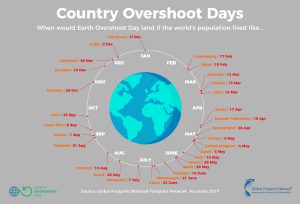
Country Overshoot Days
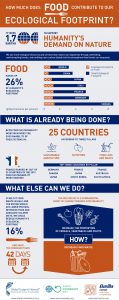
How much does food contribute to our ecological footprint?
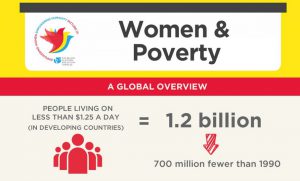
Women and Poverty: a global overview
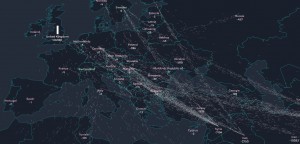
Asylum seekers: the flow towards Europe
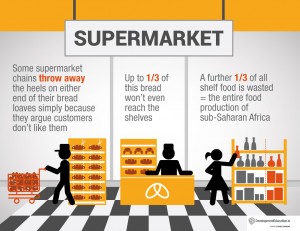
Supermarket food waste
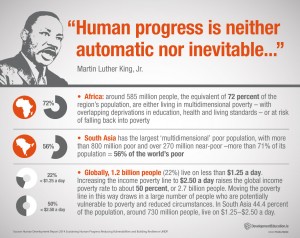
Human progress is neither automatic nor inevitable
The benefits and hazards of fracking
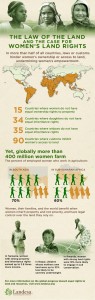
The Law of the Land: Women’s Right to Land
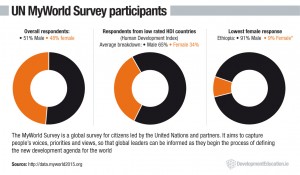
UN MyWorld Survey: Did females from developing countries really get a voice?
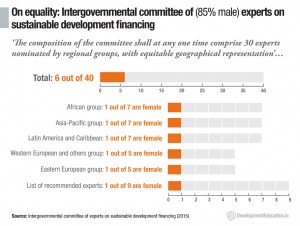
Gender inequality in the committee of sustainable development financing
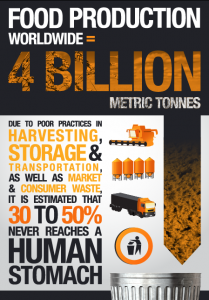
Food production worldwide
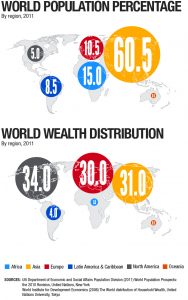
Population v wealth distribution
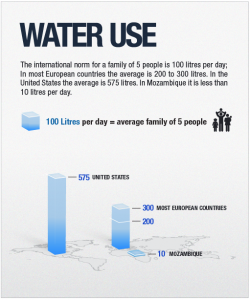
Global inequalities in water use
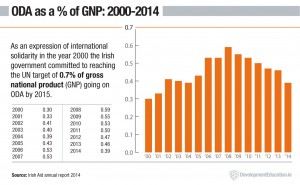
Ireland: overseas aid as % of GDP 2000-2014
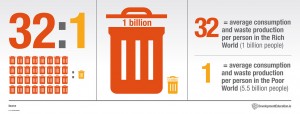
Comparing consumption 32:1
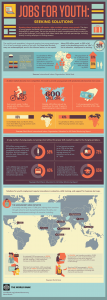
Global youth (un)employment
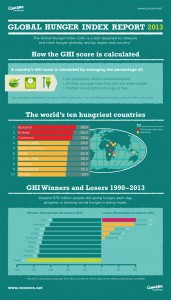
Concern: Global Hunger Index Report 2013
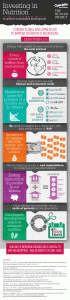
Concern: Investing in nutrition sustainable development
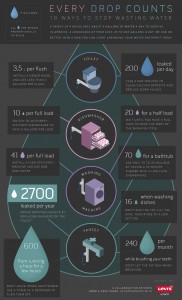
Every Drop Counts: 10 ways to stop wasting water
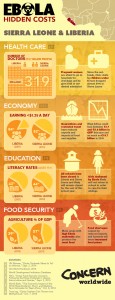
Hidden costs of Ebola: Sierra Leone & Liberia
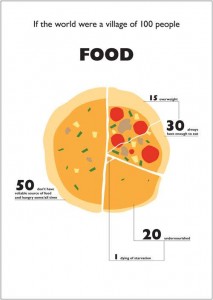
If the world were 100 people: Food
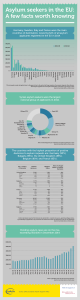
Asylum seekers in the EU: a few facts worth knowing
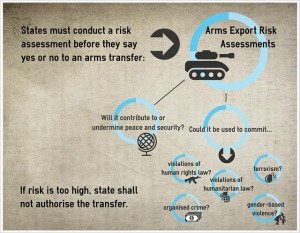
How the Arms Trade Treaty works
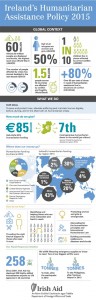
Ireland’s humanitarian assistance policy 2015
Sexual violence against women: the hard truths
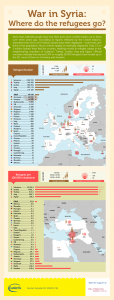
War in Syria: where do the refugees go?
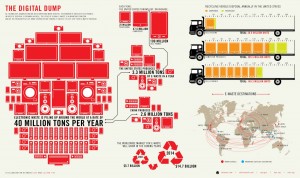
The Digital Dump: the problem of electronic waste
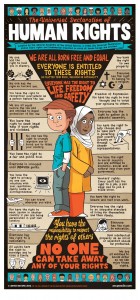
The Universal Declaration of Human Rights